Netflix Data Analysis & Power BI Dashboard
This project explores Netflix’s content trends using Python and Power BI. By analyzing movie and TV show data,
i uncover genre popularity, country-wise distribution, and content growth patterns over the years. This data-driven
approach provides insights for content strategists, media analysts, and Netflix decision-makers.Developed an interactive
and professional dashboard analyzing Netflix's content trends using Power BI and Python. The project provides deep insights
into the platform’s global catalog of Movies and TV Shows, focusing on content distribution, genre popularity, and geographical
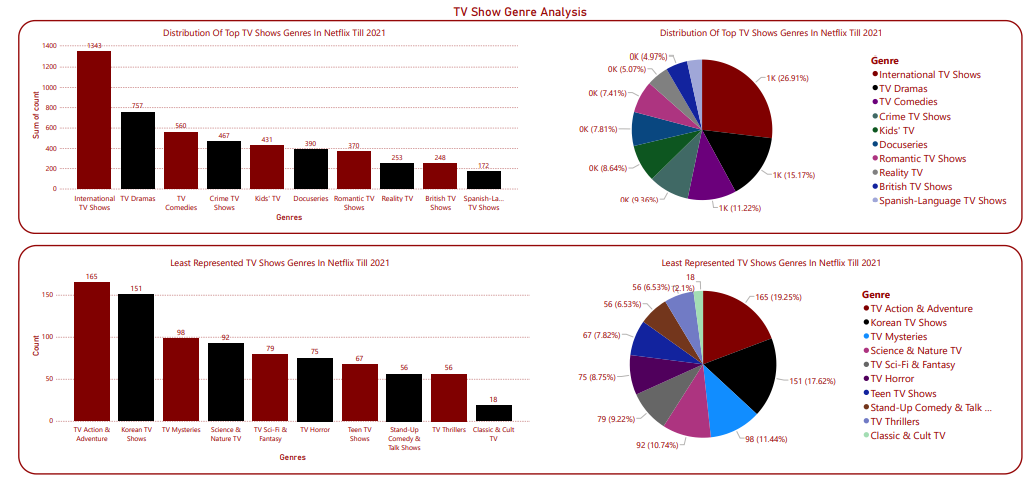
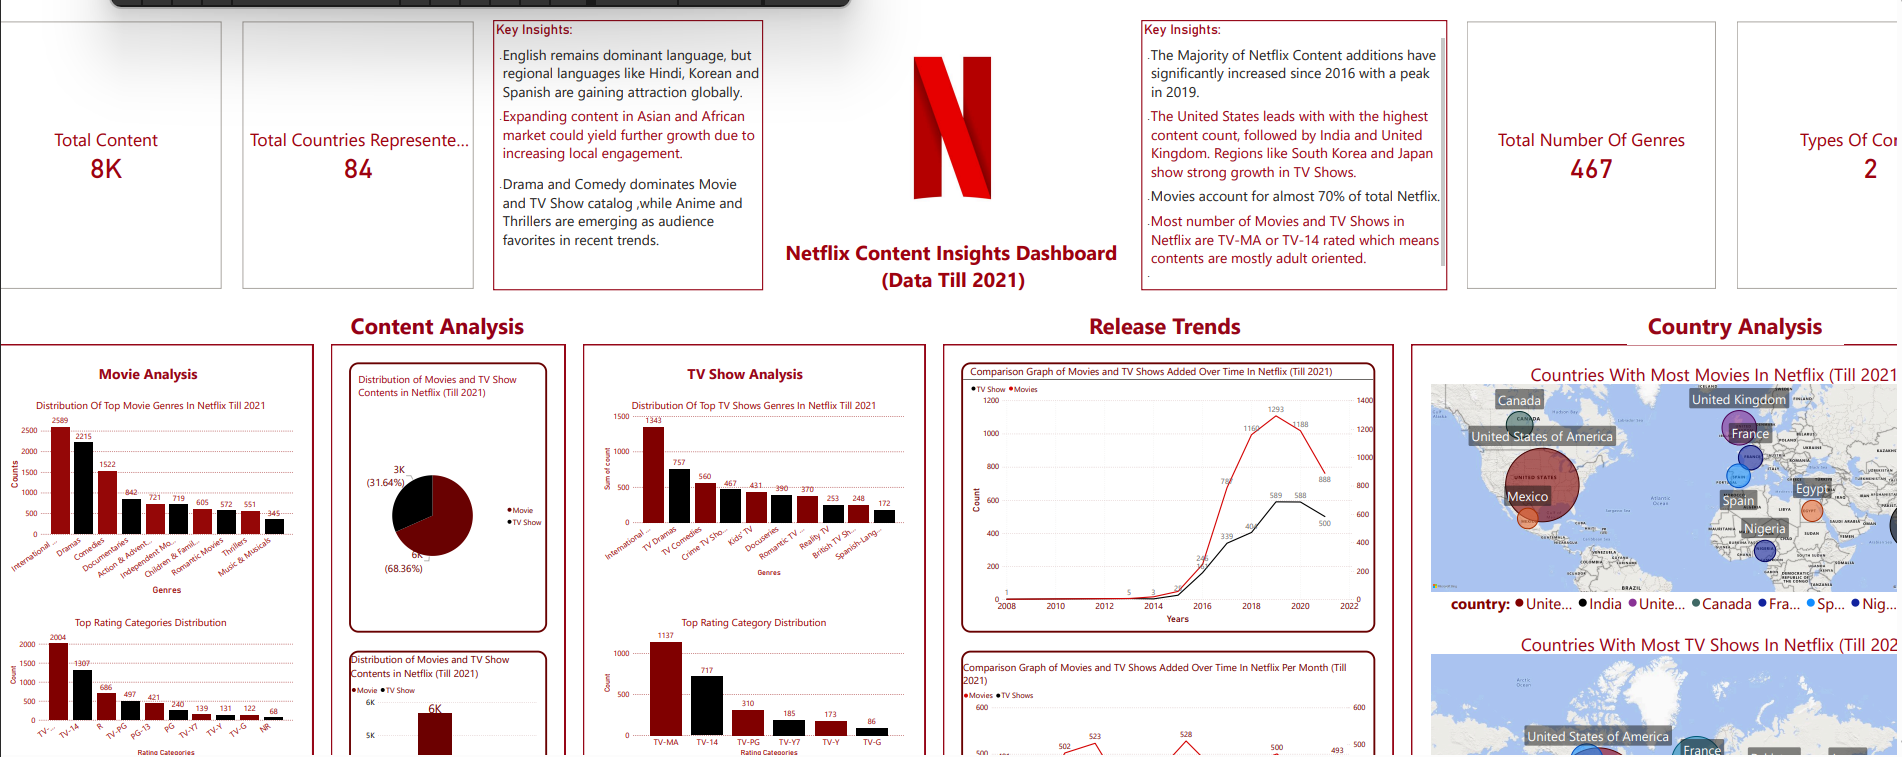
trends.Designed a one-page dashboard incorporating 17+ visualizations for a holistic view.Conducted genre analysis revealing dominant
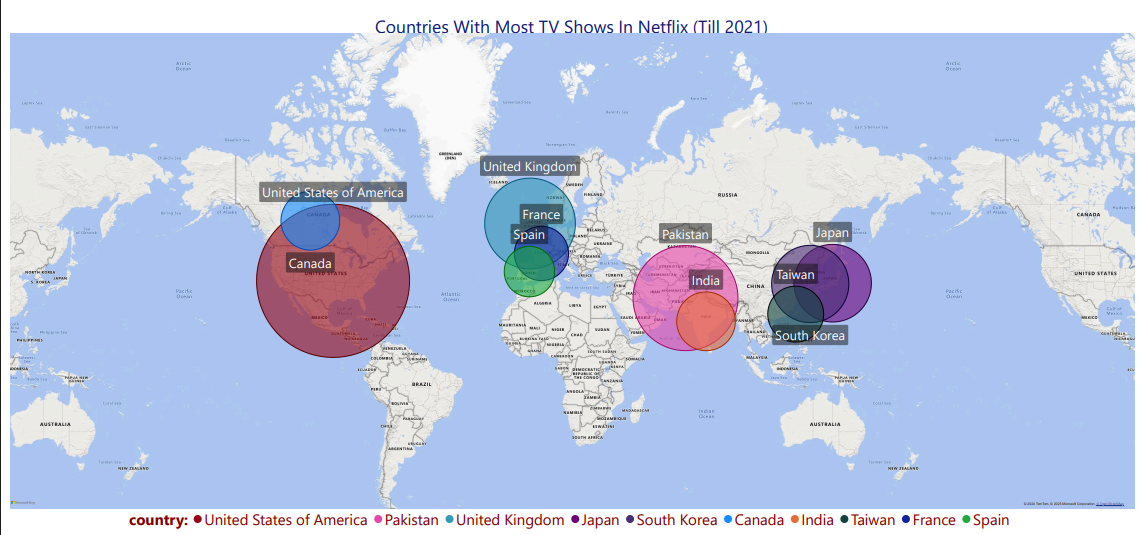
categories like Drama and Comedy, with Anime and Thrillers as emerging favorites. Performed geospatial mapping to showcase country-specific
content trends using latitude and longitude data. Leveraged Python (Pandas, Matplotlib, Seaborn) for data preprocessing and additional
custom visualizations.
Key Highlights:
17+ Visualizations in a single Power BI dashboard
Genre & Country-Wise Content Trends
Interactive Geospatial Mapping
Python-Driven Data Preprocessing (Pandas, Seaborn, Matplotlib)
Project Components:
- Data Analysis & Preprocessing
- Exploratory Data Analysis & Insights
- Interactive Power BI Dashboard
🔹 Data Analysis & Preprocessing
- Dataset Source: Netflix Dataset (Kaggle)
- Data Cleaning: Removed duplicates, handled missing values.
- Feature Engineering: Extracted 'Content Age,' 'Primary Genre,' and 'Content Type' (Movies vs. TV Shows).
🔹 Exploratory Data Analysis & Insights
- Netflix's content library has expanded significantly since 2010, with peak additions around 2018.
- Movies dominate the platform, but TV shows have higher engagement.
- Drama and Comedy are the most common genres; Thrillers and Anime are growing in popularity.
- The USA and India contribute the most titles, with a rising presence from European and Asian markets.
- Most content is rated TV-MA, indicating a focus on mature audiences.
Interactive Power BI Dashboard
- Visualizes Netflix content trends using bar charts, heatmaps, and line graphs.
- Includes dynamic filters for interactive exploration.
- Helps media analysts track content growth, genre trends, and regional preferences.